Note
Go to the end to download the full example code.
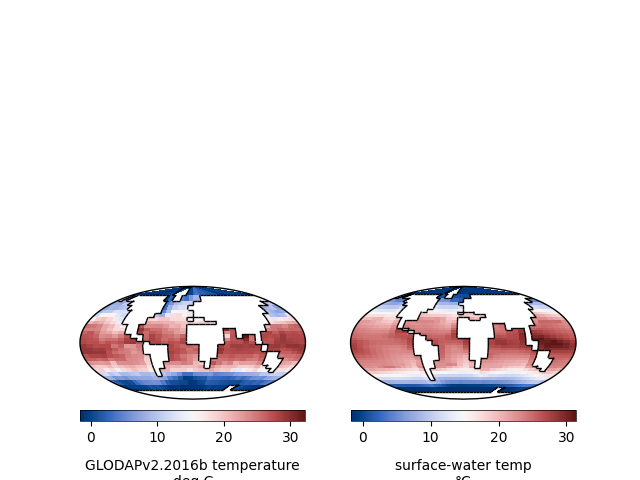
Regrid observational data and compare with cGENIE output#
This example shows how to regrid observational data to cGENIE grids and compare with cGENIE output.
This example uses many features from the cgeniepy package, including:
GirdOperation (eastern to normal longitude conversion)
Read cGENIE output
Bin observational data to cGENIE grid (a coarse implementation)
Visualisation based on cgeniepy’s customised plotting functions
Compare model and observational data
The GLODAPV2 data is from https://glodap.info/index.php/mapped-data-product/.
Downloading GLODAPv2.2016b.temperature.nc to /home/docs/.cgeniepy/GLODAPv2.2016b.temperature.nc...
Download complete.
/home/docs/checkouts/readthedocs.org/user_builds/cgeniepy/envs/stable/lib/python3.12/site-packages/cgeniepy/model.py:58: UserWarning: No gemflag is provided, use default gemflags: [biogem]
  warnings.warn("No gemflag is provided, use default gemflags: [biogem]")
M-score of sea surface temperature 0.8293330629170114
import xarray as xr
import numpy as np
import matplotlib.pyplot as plt
import cartopy.crs as ccrs

import cgeniepy
from cgeniepy.table import ScatterData
from cgeniepy.grid import GridOperation
from cgeniepy.array import GriddedData
from cgeniepy.model import GenieModel
from cgeniepy.skill import ArrComparison
from cgeniepy.utils import download_zenodo_file


record_id = "13786013"
filename = "GLODAPv2.2016b.temperature.nc"
local_file_path = download_zenodo_file(record_id, filename)

## load GLODAP temperature data
glodap_temp = xr.load_dataset(local_file_path)['temperature']
## convert to normal longitude from eastern longitude
glodap_temp = GridOperation().xr_e2n(glodap_temp)
## convert to ScatterData
glodap_temp = ScatterData(glodap_temp.isel(depth_surface=0).to_dataframe())
## bin into genie coordinate and convert back to xarray
glodap_temp = glodap_temp.to_geniebin(var='temperature').to_xarray()['temperature']

## This is cGENIE output
model = cgeniepy.sample_model()
genie_sst = model.get_var('ocn_sur_temp').isel(time=-1).normalise_longitude(method='g2n')

## The binned GLODAP data does not consider how land-sea mask is in cGENIE
## here just lightly mask the glodap data for better looking
worlg4_mask = np.isnan(model.get_var('grid_mask').normalise_longitude(method='g2n').data)
masked_glodap_temp = glodap_temp.where(~worlg4_mask)
masked_glodap_temp = GriddedData(masked_glodap_temp, attrs=glodap_temp.attrs)
masked_glodap_temp.attrs['long_name'] = 'GLODAPv2.2016b temperature'
masked_glodap_temp.attrs['units'] = 'deg C'

## plot both data
fig, axs = plt.subplots(1,2,subplot_kw={"projection": ccrs.Mollweide()})
masked_glodap_temp.plot(ax=axs[0], outline=True, colorbar=True)
genie_sst.plot(ax=axs[1], outline=True, colorbar=True)

## calculate the skill score
print("M-score of sea surface temperature",ArrComparison(glodap_temp.values, genie_sst.data.values).mscore())
Total running time of the script: (1 minutes 22.500 seconds)