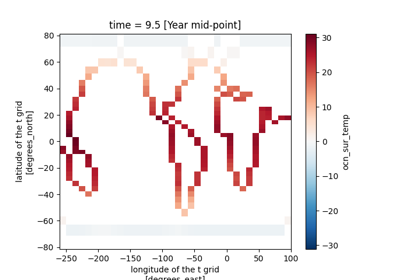
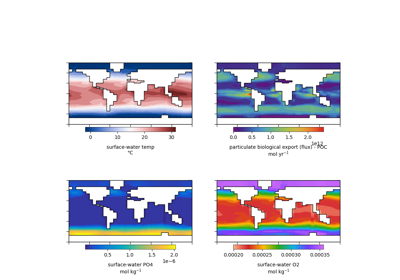
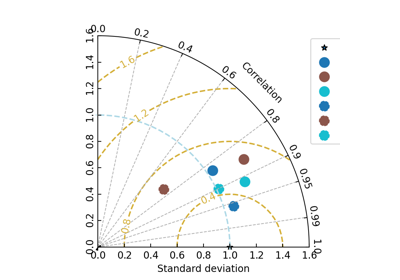
Gallery#
Below is a gallery of examples


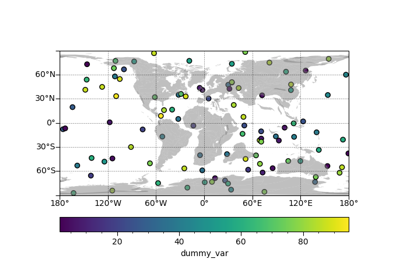


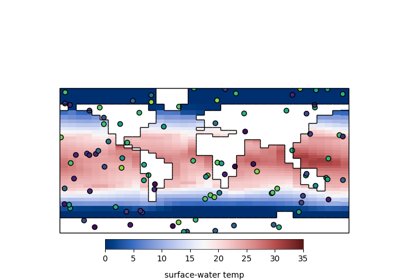
Search the nearest grid point for a given location
Search the nearest grid point for a given location
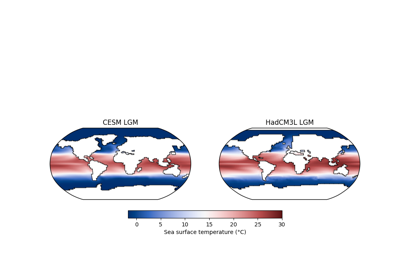
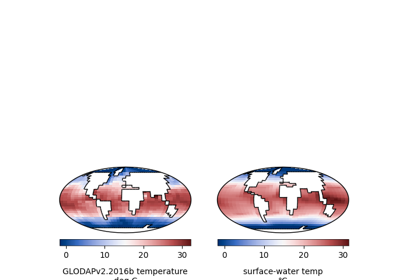
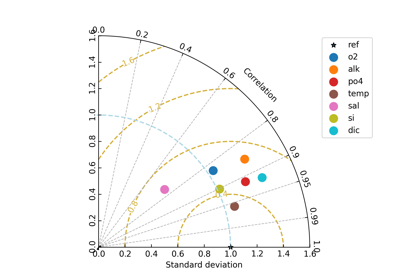
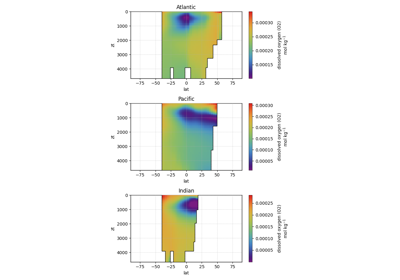
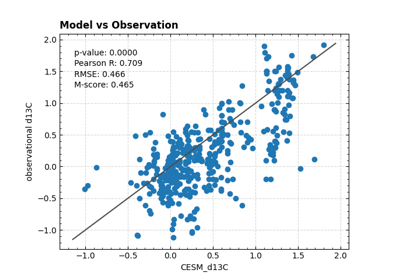
Regrid observational data and compare with cGENIE output
Regrid observational data and compare with cGENIE output