Note
Go to the end to download the full example code.
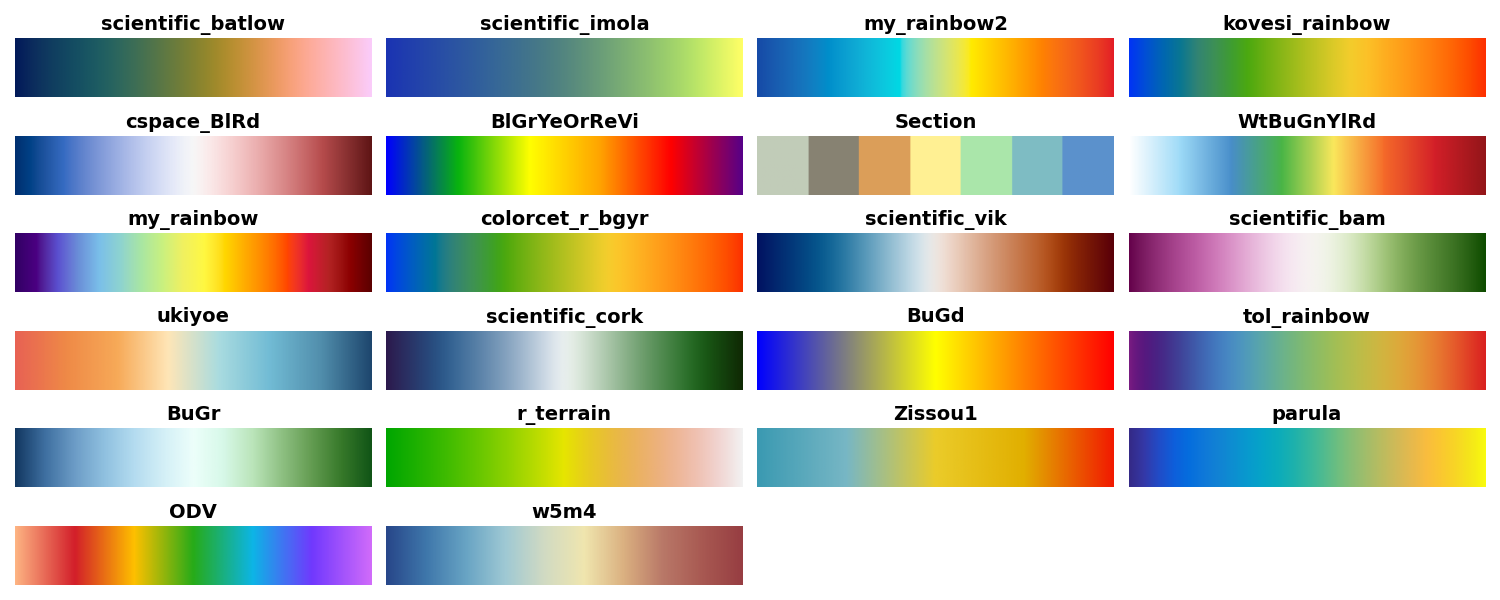
Get additional color palettes#
I created a class called CommunityPalette for accessing those pretty color palettes that are widely seen in oceanography but not directly available in Python. This can be from Ocean Data View (ODV), NCL, Ferret, etc.
In this example, I will show these available color palettes in the CommunityPalette class. But the majority of them is from Ferret (Thank the Ferret community for making this open sourced), which can be found in https://ferret.pmel.noaa.gov/Ferret/faq/ferret-color-palettes
import numpy as np
import matplotlib.pyplot as plt
from cgeniepy.plot import CommunityPalette

def plot_colormaps(cmaps):
    ncols = 4
    nrows = int(np.ceil(len(cmaps) / ncols))
    fig, axes = plt.subplots(nrows, ncols, figsize=(15, nrows))

    for i, cmap_name in enumerate(cmaps):
        row = i // ncols
        col = i % ncols
        ax = axes[row, col] if nrows > 1 else axes[col]

        # Create a gradient image using the colormap
        gradient = np.linspace(0, 1, 256).reshape(1, -1)
        ax.imshow(gradient, aspect='auto', cmap=CommunityPalette().get_palette(cmap_name))
        ax.set_title(cmap_name, fontsize=14, fontweight='bold')
        ax.axis('off')

    ## remove the unused axes
    for i in range(len(cmaps), ncols * nrows):
        row = i // ncols
        col = i % ncols
        fig.delaxes(axes[row, col])

    plt.tight_layout()

# List of colormaps from cgeniepy
cmaps_list = CommunityPalette().avail_palettes(show_ferret_data=False)
plot_colormaps(cmaps_list)
Total running time of the script: (0 minutes 0.436 seconds)